S-Meter
Louder, louder, ...
Introduction
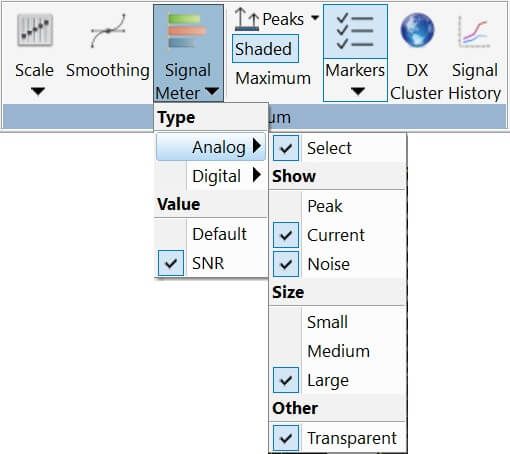
Select
There is an entry in the ribbon bar where you select the S Meter style and other options: Ribbon bar, View, Spectrum, Signal Meter.
Standard
The standard comes from "IARU Region 1 Technical Recommendation R.1":
STANDARDISATION OF S-METER READINGS
- One S-unit corresponds to a signal level difference of 6 dB,
- On the bands below 30 MHz a meter deviation of S-9 corresponds to an available power of -73 dBm from a continuous wave signal generator connected to the receiver input terminals,
- On the bands above 144 MHz this available power shall be -93 dBm (Note: not currently implemented),
- The metering system shall be based on quasi-peak detection with an attack time of 10 msec ± 2 msec and a decay time constant of at least 500 msec.
Signal to Noise Ratio (SNR)
FFT Algorithm
The IQ data from the SDR is converted from the time domain to the frequency domain with a 32-bit floating point version of the FFT algorithm. The algorithm is one of:
- Intel IPP runs on the CPU,
- NVIDIA CUDA runs on a NVIDIA graphics card if the card has CUDA cores, or
- OpenCL runs on almost any graphics card,
all of which can safely be considered as very accurate.
Signal Level
This is the peak spectrum FFT bin (output value) which is within the current filter. Note: This value will probably differ from the actual spectrum trace as the spectrum trace uses smoothing to make the display more aesthetically pleasing and less tiring on the eyes.
Noise Floor
Purists may not be happy with the logic used to determine the noise floor - they rarely are, but it works for me.
- The S Meter values are derived from the spectrum's FFT which runs at 20 updates / second.
- Windowing can affect the FFT output, in fact it will. The spectrum FFT windowing is the same as the waterfall, selected from the ribbon bar, View, Waterfall, Windowing.
- Take the output from the SDR radio, ignore 15% of the bandwidth at the high and low end of the output to avoid the ant-alias filtering, and we're left with a healthy 70% of the signal.
- Sort the FFT bins (output values) by value, take the mean (average) of the lowest 10% and that's the noise floor.
Accuracy
Absolute
The absolute accuracy will not be exact - calibration of signal levels will be added to Console as and when time permits.
Relative
Direct sampling SDRs such as ELAD S2/S3, Perseus or NetSDR will be best As long as the SDR is not overloaded. SDRs using tuner chips can be very good but may suffer from compression if hardware AGC is enabled, for example ADALM Pluto and Lime.
Visual Gain
Some SDR implementations have a Visual Gain option, this is purely a numerical IQ gain factor and does not affect any SNR measurement. Visual Gain is used to provide a rough calibration of signal levels.
Summary
S Meters can display not just the signal level, but also the Signal to Noise Ratio (SNR) which is often more meaningful.
Note: When no signals are present with the SNR display it is quite normal to see a SNR reading. This is because Noise is the mean (average) whereas Signal is the peak value, so even in a quiet part of the band there will be a difference between the peak and mean. To see this yourself change the Smoothing algorithm to None (Ribbon Bar, View, Spectrum, Smoothing). The default smoothing is very good at eliminating noise.
You see the same effect with a 'normal' receiver which has a S meter - even on a quiet band it will be moving and following peaks in the noise.New Paragraph
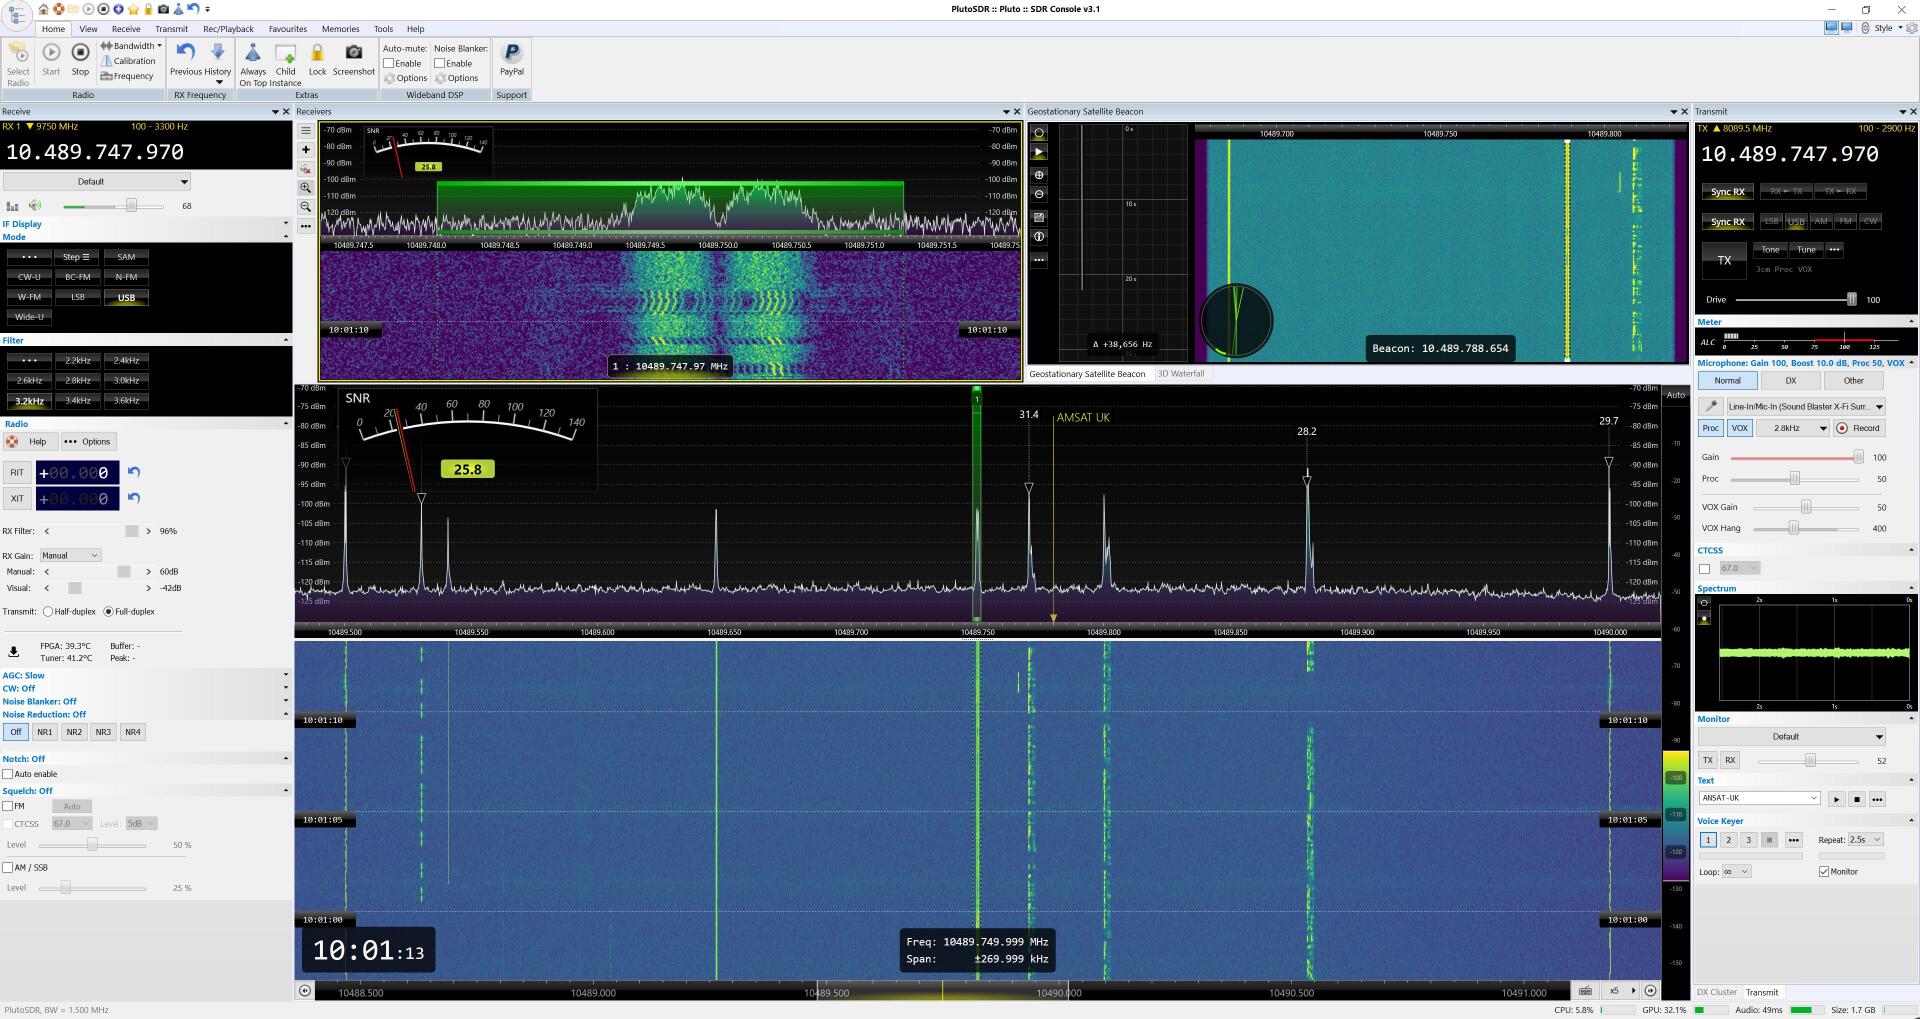
High Zoom
If the main window has a high zoom applied then there will be fewer FFT bins in the main window, as a result the noise floor value will be less accurate. If a high zoom is required use a receiver window as shown in the image below where you see the main and receiver window (high zoom) show the same SNR value.
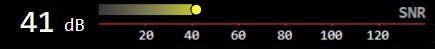
Digital
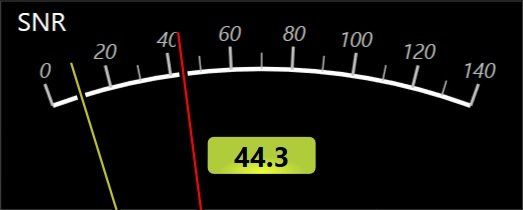
Analog
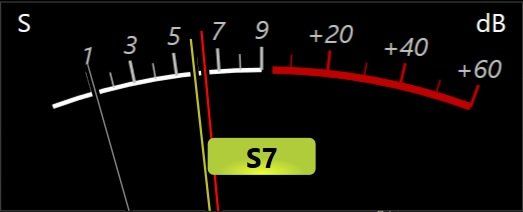
S Units
- Red = peak signal
- Yellow = current signal
- Grey = noise floor
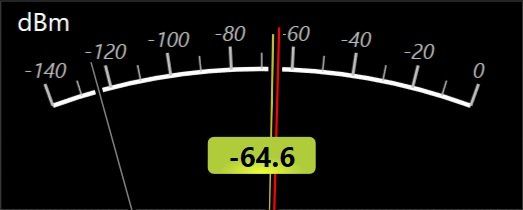
dBm
SNR