Signal History
We cannot escape history
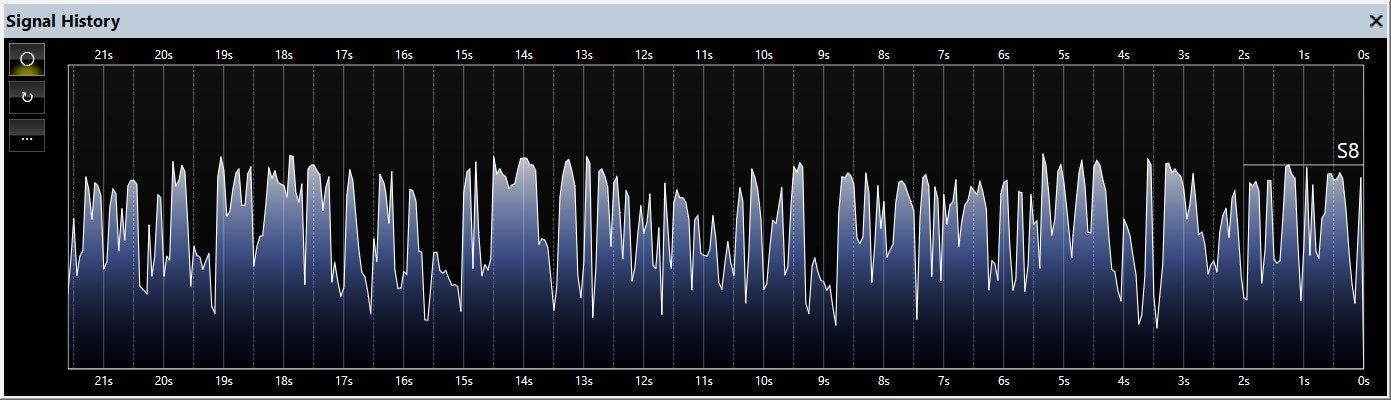
Display
To display the Signal History:
- Ribbon bar,
- View,
- Spectrum,
- Signal History.
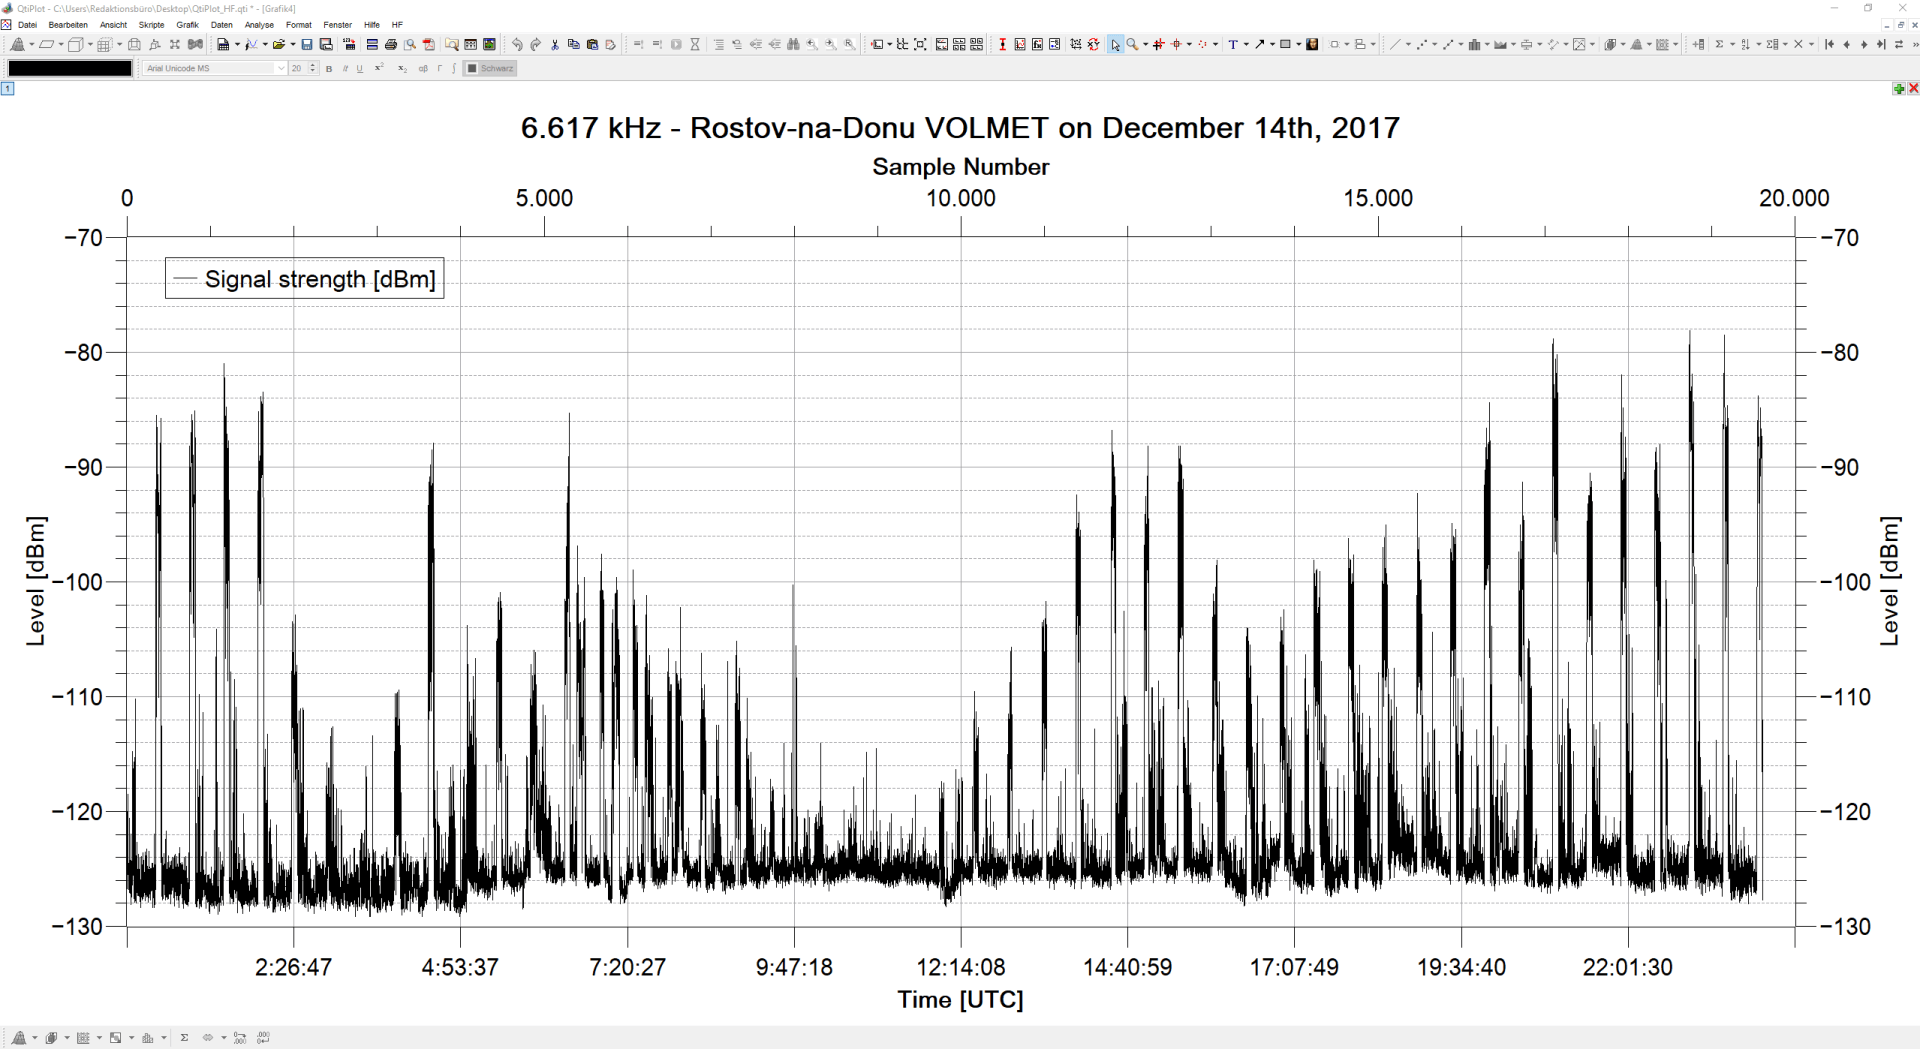
The signal history can store up to 48 hours of data, the data can be exported in CSV format to third-party programs such as:
DPLOT http://www.dplot.com/
QtiPlot http://www.qtiplot.com/
SciDAVis http://scidavis.sourceforge.net/
An example from Nils Schiffhauer using QtiPlot:
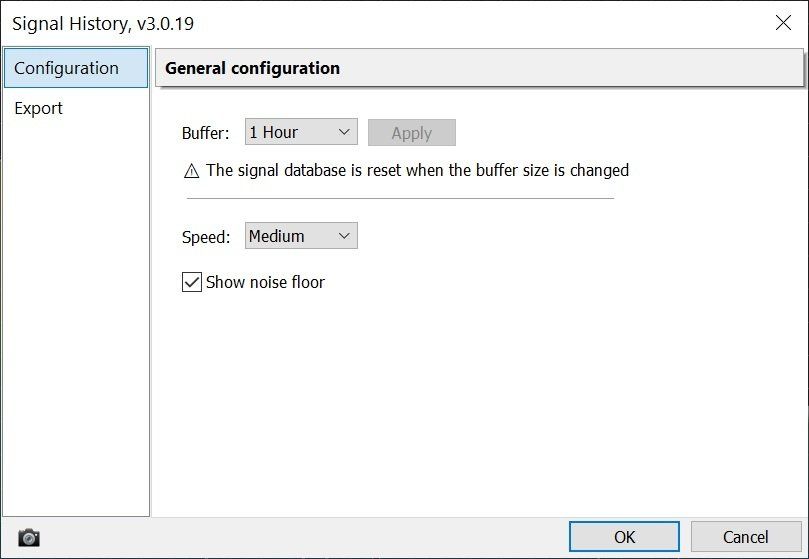
Options
Click the … button on the left of the display.
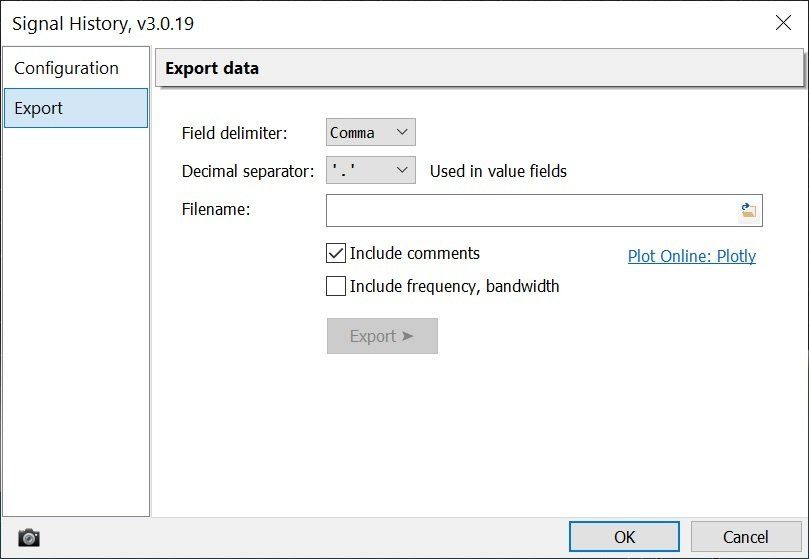
Export the data for detailed analysis with 3rd-party tools such as Ploty.
Microsoft Excel has easy to use charting options.
Here you select:
- Buffer size,
- Display scroll speed,
- Whether noise floor is also displayed.
The buffer size is important if you later export the data (below).