Simon's World Map 1.5.1
Version 1.5.1
This is a mainly cosmetic update to version 1.5, nevertheless well worth installing.

Appearance
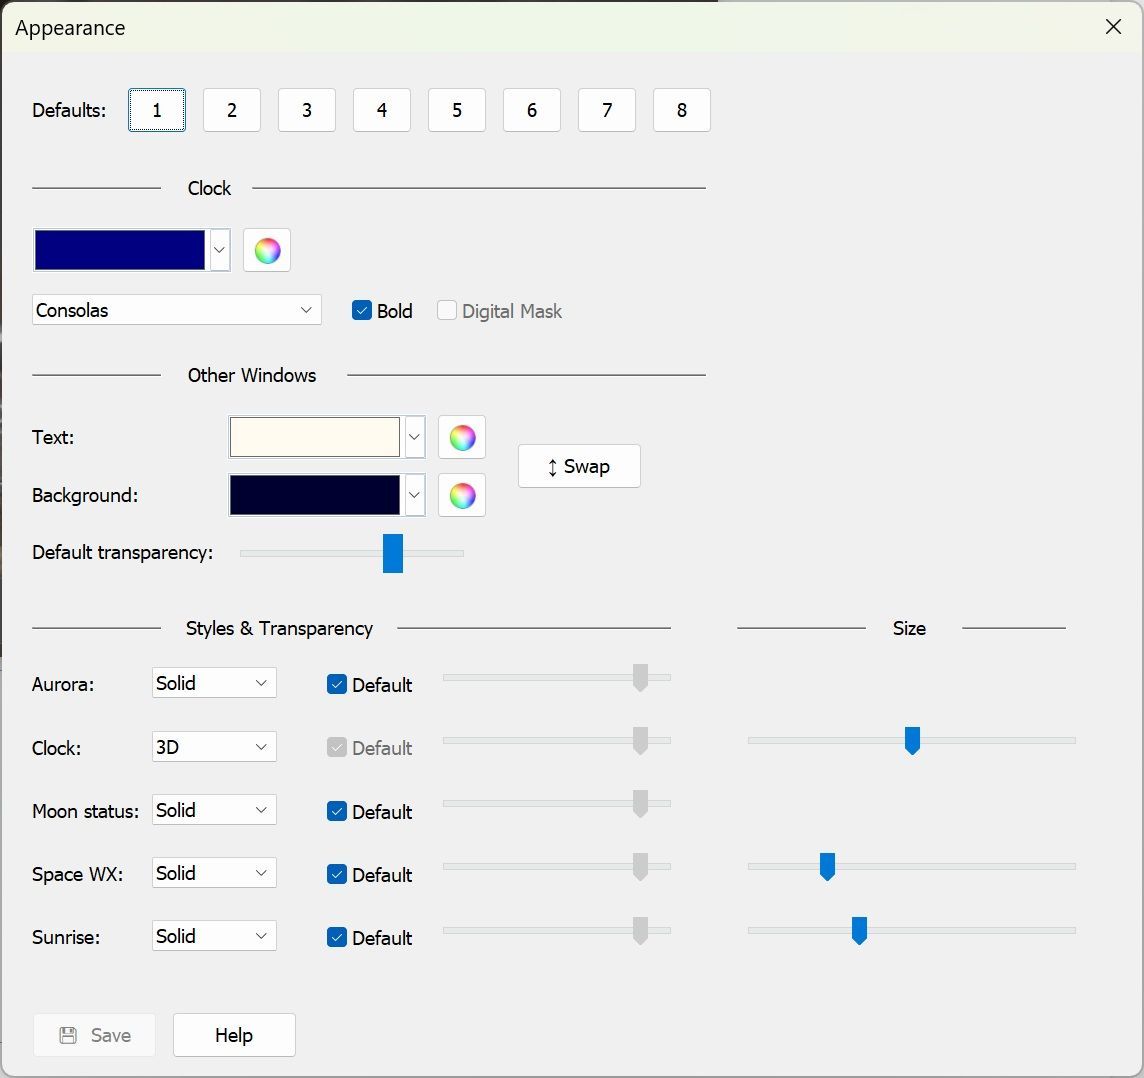
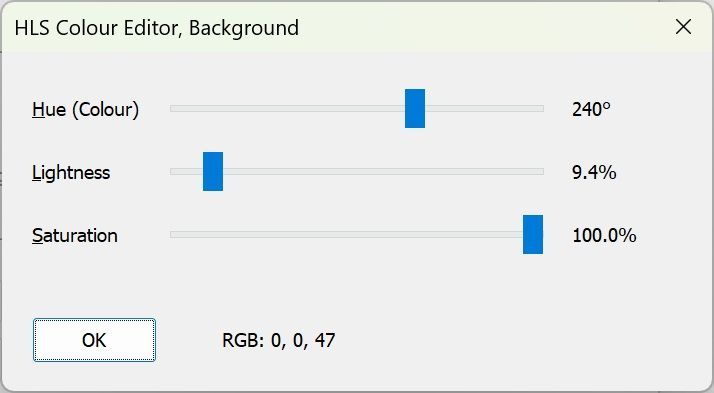
The Appearance window has been refreshed, simplified. The defaults have been changed to have a dark background and a light text. A HLS (Hues, Lightness, Saturation) colour editor has been added, selected from the colour-wheel button to the right to the main colour-selection options.
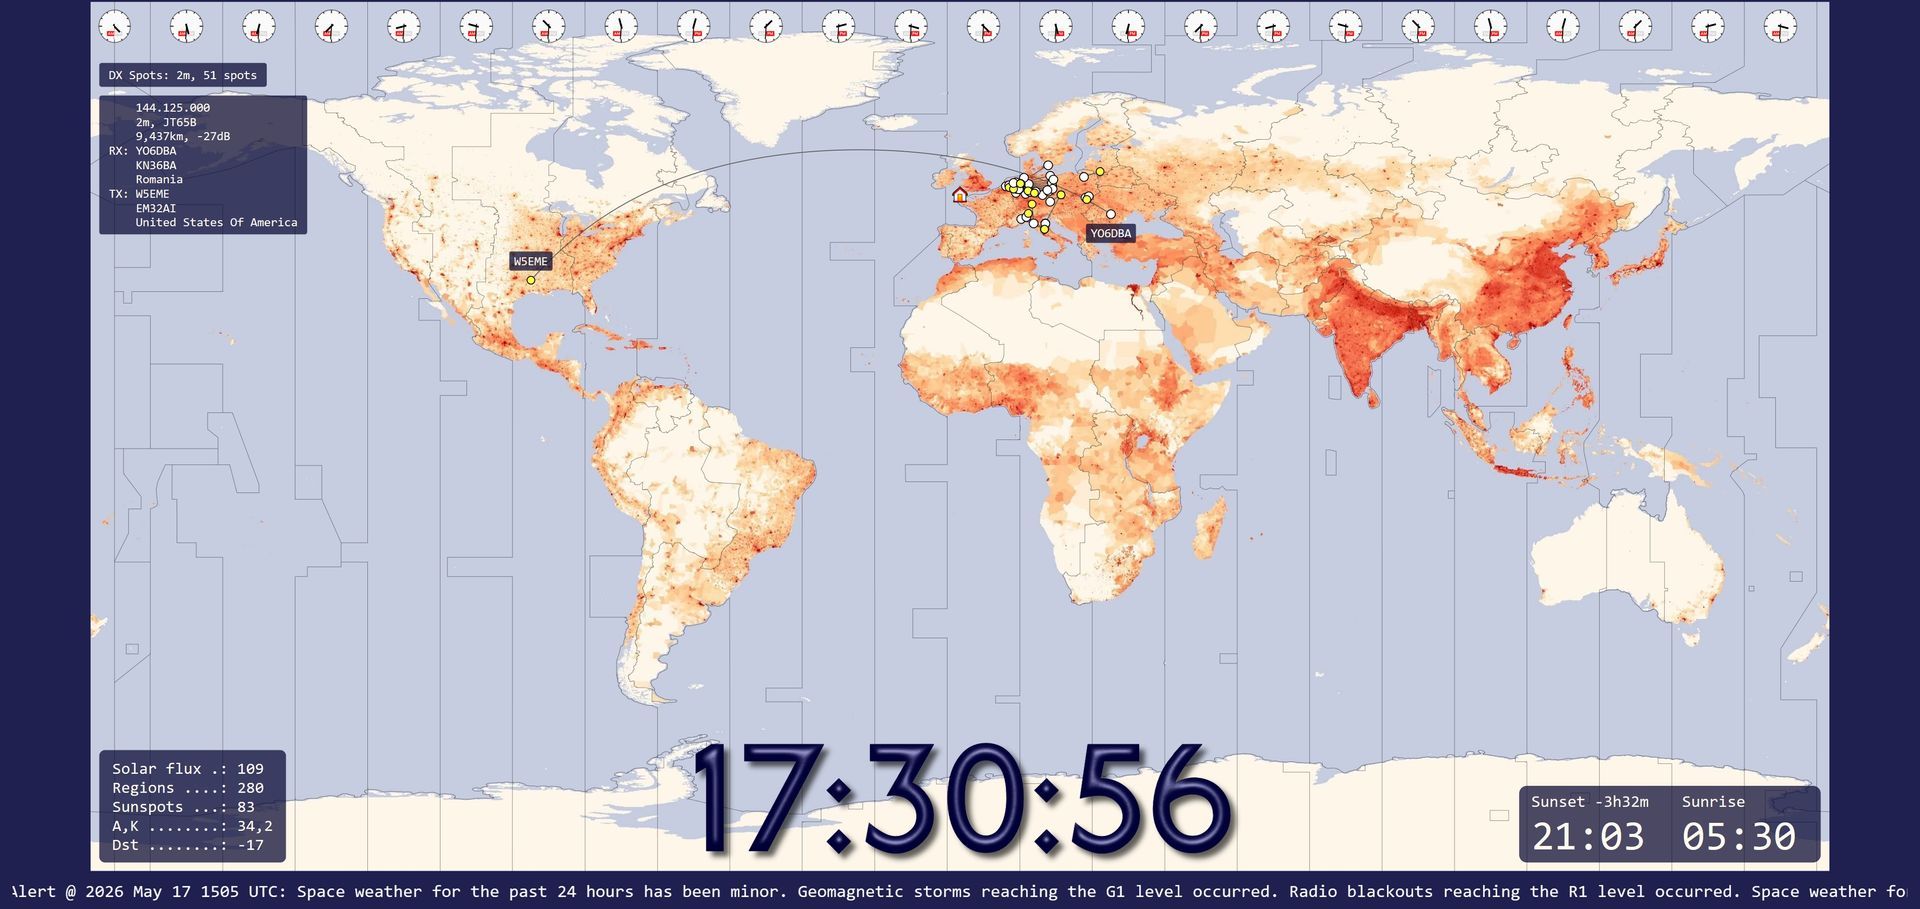
The Space weather and Sunrise windows now have a border, drawn with the text colour.
Aurora
The aurora legend has been increased in size to make it easier to read.
Clock
The clock now has its own colour setting (see Appearance above).
Grid Squares
Added a Help button to the grid squares panel in the ribbon bar.
Layouts
The layouts (Ribbon bar, View, Layout) have been updated to fix a few minor bugs, also a Reset button has been added.
Maps
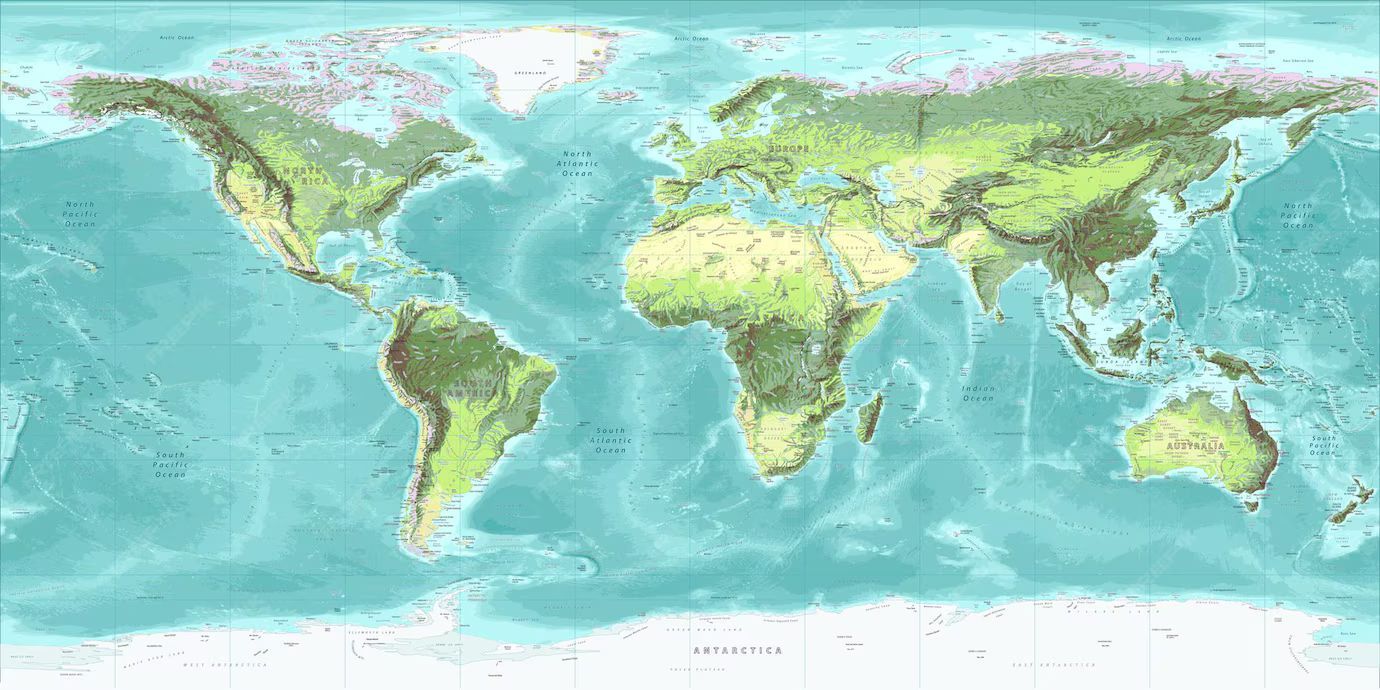
A new map, purchased from Vecteezy for 'Detailed Physical Green' by Sam Kal.
Stations
- When changing definitions and layout options the map is dynamically updated.
- When displayed on the side of the map, the station windows are now centred vertically.
- The station layout window also supports the new HLS colour editor.
Previous: Version 1.5
May 25th, 2025: After spending almost 18 months on the SDR Television project, Simon's World map has been given some attention.
User Interface
I find user interfaces (UI) difficult, I've never been much good at them. Here's what's changed:
- Ribbon Bar, Home panel:
- Now starts with the Home location configuration, this was previous found mixed up with the Centre buttons.
- Some centre icons updated.
- Most importantly, the Maps selection has its own panel!
- New Maps panel, this makes map selection far easier.

Satellites
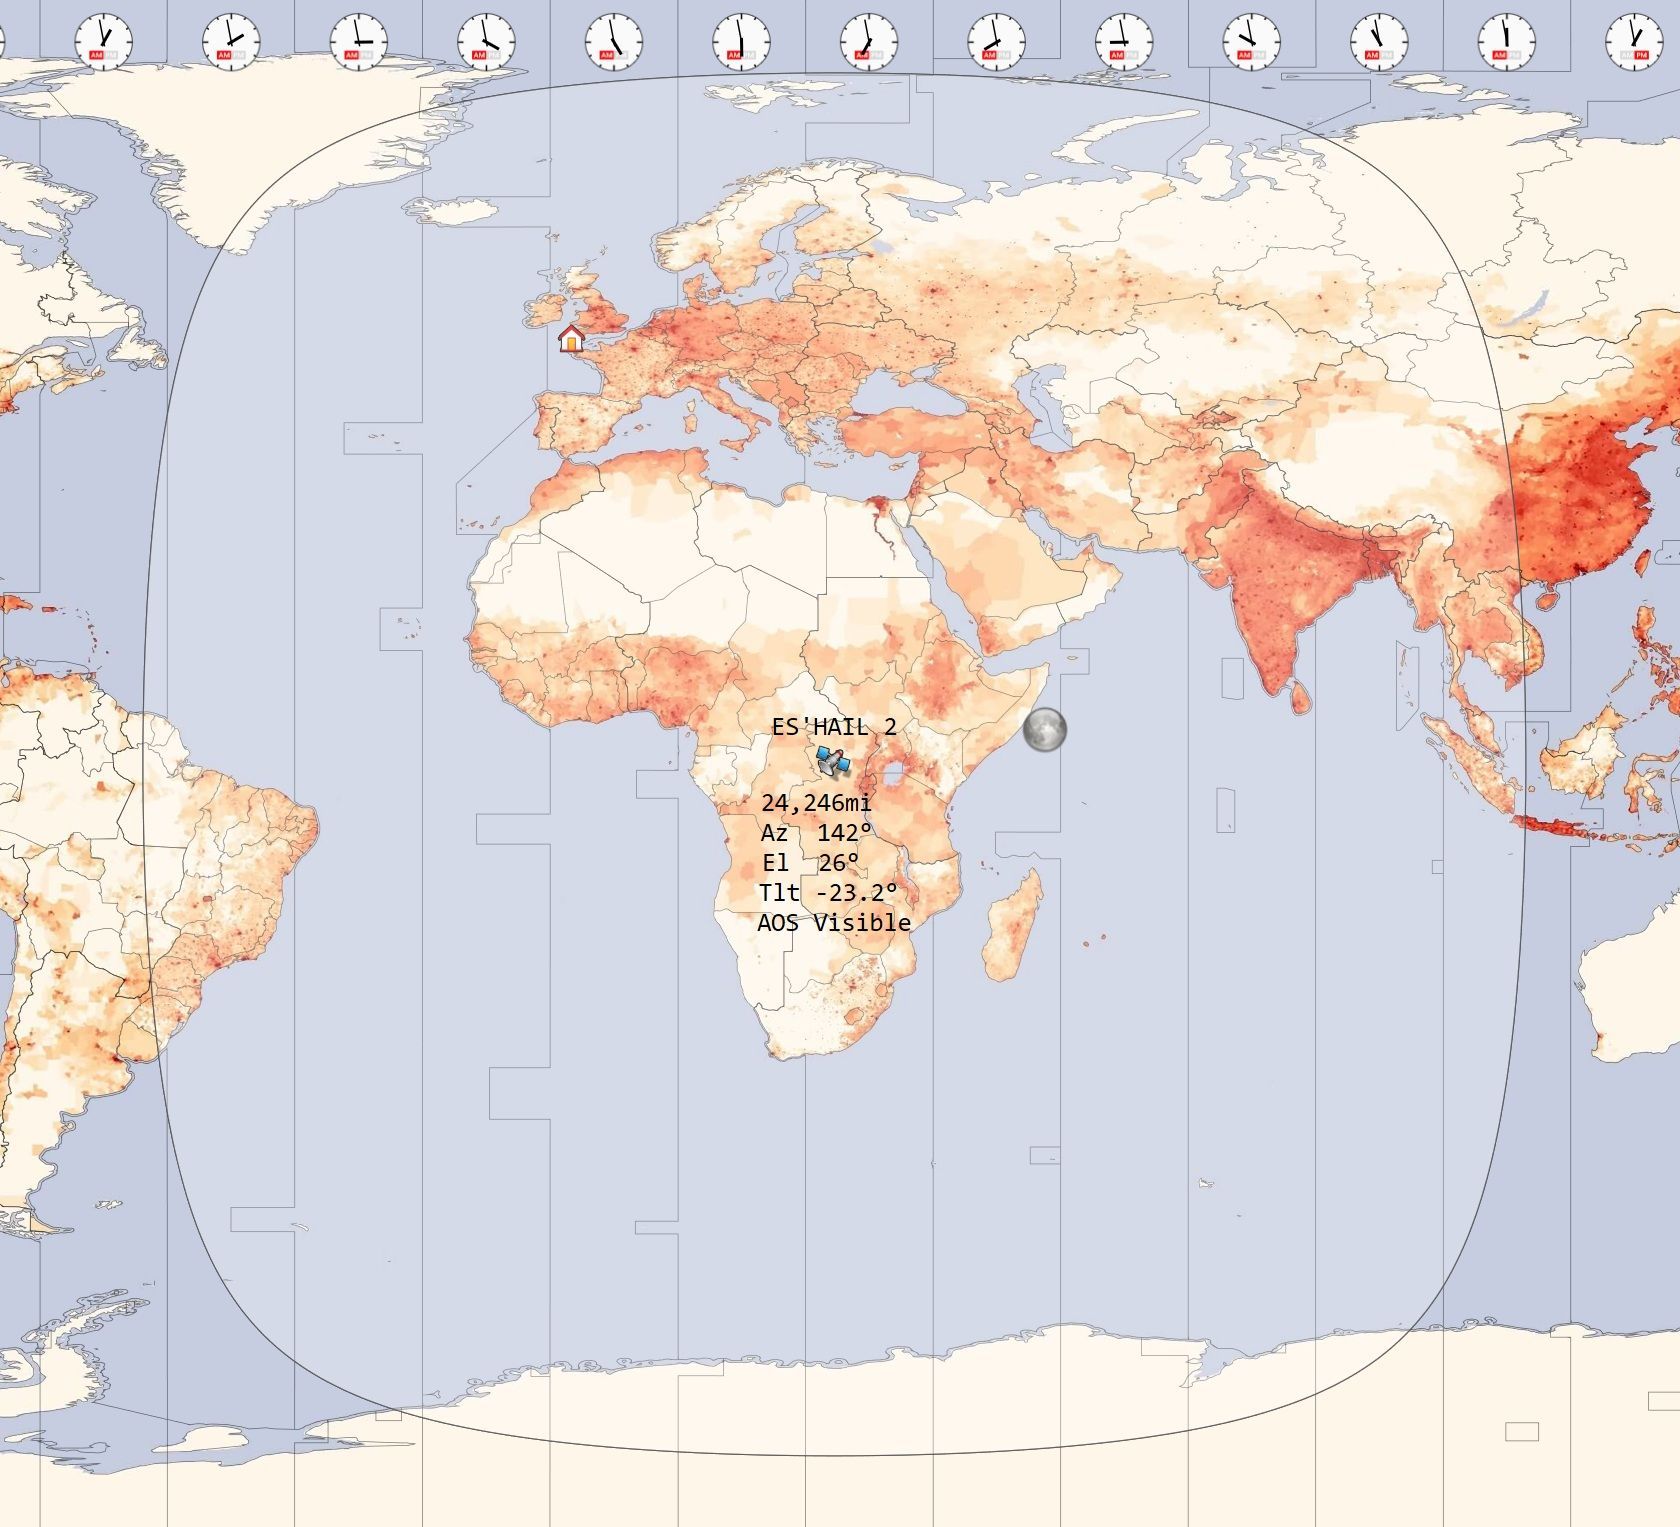
If you use the geostationary Es'hail 2 (a.k.a. Qatar-OSCAR 100 or QO-100) satellite then the LNB skew is important (the correct term is Polarisation Tilt). Although websites exist which show the skew for a given location, I wanted to know how to calculate this myself. So, many thanks to Mike G0MJW who showed me the formula. As a result the tilt is now shown as part of the satellite data. below you see a tilt value of -23.2 degrees, to compensation the LNB is rotated anticlockwise.
The formula in C++:
double dStationLatitude = 50.10496000; // In degrees, North
double dStationLongitude = -5.12795000; // In degrees, West
double dLongitudeDifference = dStationLongitude - dSatelliteLongitude; // In degrees
double dRadian = RADIANS_TO_DEGREES;
double dTan = tan(dStationLatitude/dRadian);
double dSin = sin(dLongitudeDifference/dRadian);
double dSkew = dRadian * atan(dSin/dTan);
Now have the skew in degrees.
Stations
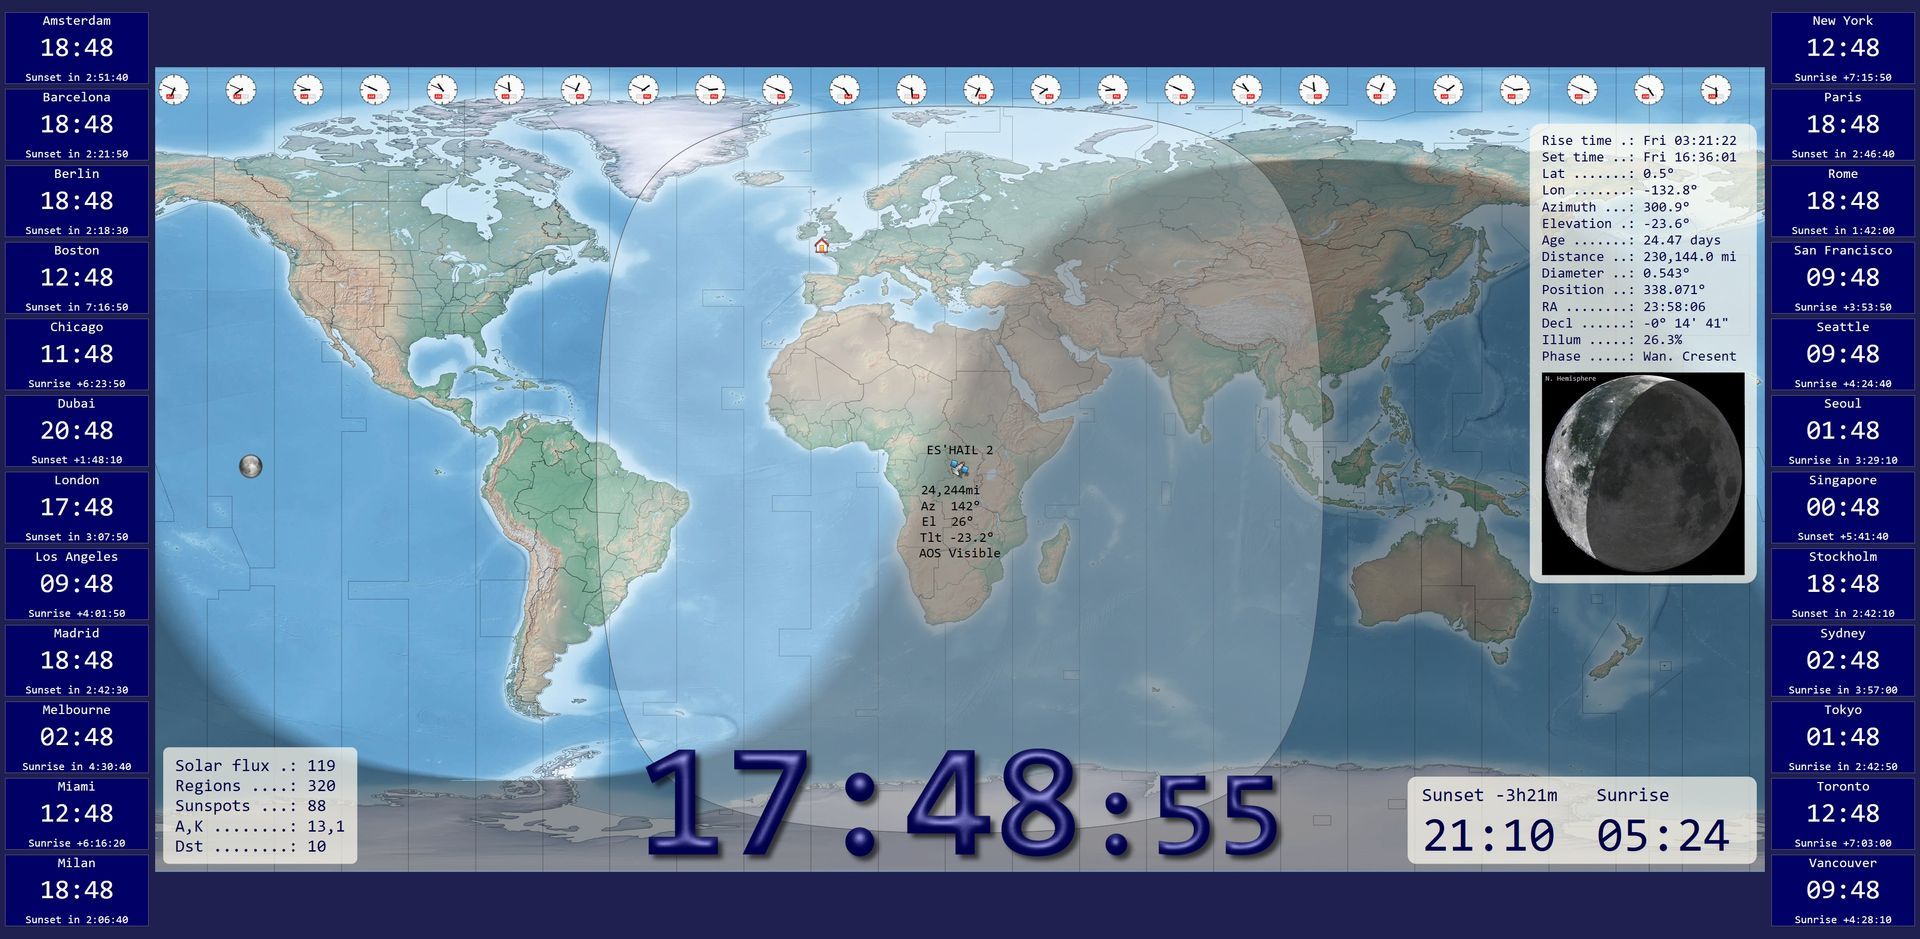
This has annoyed me for quite some time. Using feedback from users, the display can be configured as below. There are major changes:
- Stations can be shown to the left and right of the map.
- A database has been incorporated from Github which contains 7,322 major cities including country, region, latitude and longitude.
- A new default list can be selected.
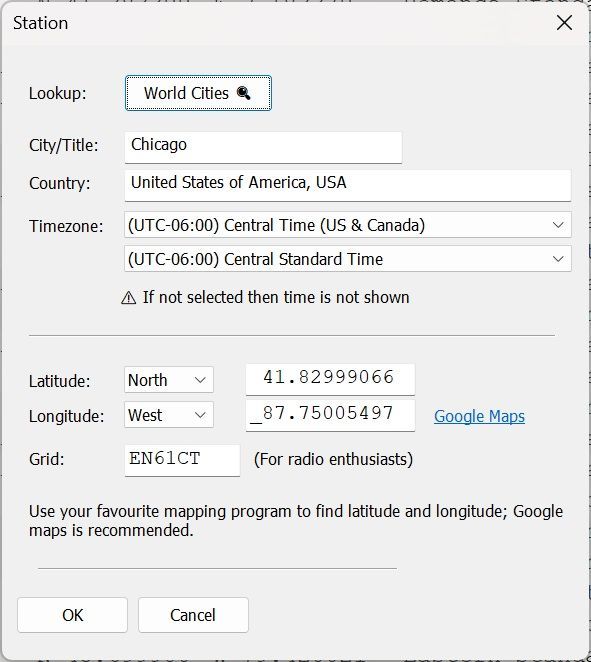
Definitions
From the ribbon bar, select Stations, Show, Definitions; the approach should be intuitive. When you create or modify a definition a new option is available: World Cities.
The data is extracted from geonames, a very exhaustive list of worldwide toponyms. This datapackage only lists cities above 15,000 inhabitants. Each city is associated with its country and subcountry to reduce the number of ambiguities. Subcountry can be the name of a state (eg in United Kingdom or the United States of America) or the major administrative section (eg ''region'' in France''). See admin1 field on geonames website for further info about subcountry.
Notice that :
- some cities like Vatican city or Singapore are a whole state so they don't belong to any subcountry. Therefore subcountry is N/A.
- There is no guaranty that a city has a unique name in a country and subcountry (At the time of writing, there are about 60 ambiguities). But for each city, the source data primary key geonameid is provided.
When you select an entry, an attempt is made to select the corresponding timezone. There's no guarantee that this is correct, the selection must be verified. A timezone is required if the time is to be shown.
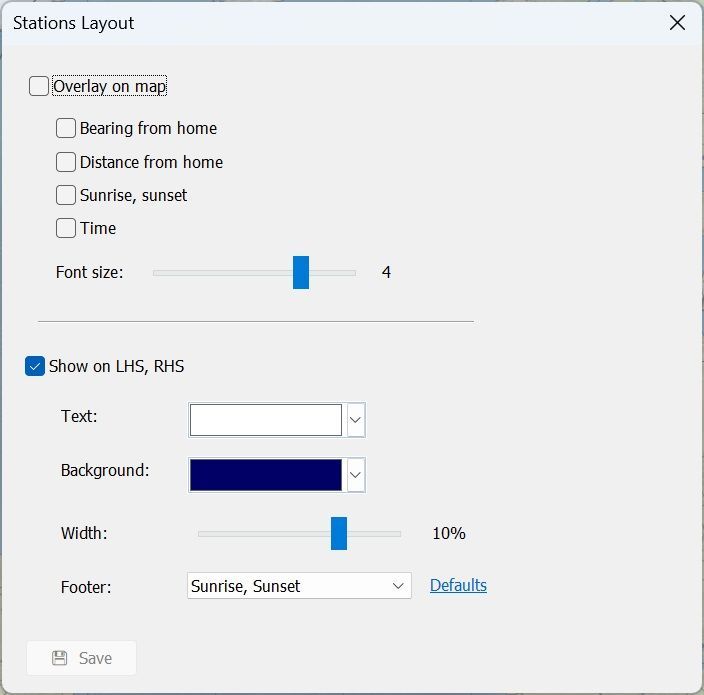
Configuration
From the ribbon bar select Stations, Show, Layout. This window is divided into two parts:
- Overlay on map - select the information to display.
- Show on the left-hand side (LHS) and, if more room is needed the right-hand side (RHS). Also select the colours and width of the station display.
Download
Downloads are here.